This post follows our in-depth investigation into how the VoC Life Cycle Analysis for Insurance providers delivers a comprehensive analysis of customer feedback that addresses the complex and interconnected relationships between a customer and a service-based renewal product like insurance.
In this post, we explore the need for trends analyses using Admiral Insurance public review data. We will identify ways to leverage this type of analysis to drive operational performance outcomes.
Key Findings
- Issues have a complex interconnected relationship with each other, without AI coding you’re not able to manually connect issues and their impacts to detect true root cause.
- Identifying that a score is changing overtime and detecting the overarching reason why is not enough to offer solutions that will have a measurable impact in operational performance.
- Detecting and resolving immediate issues will fix problems, but without an ongoing detailed analysis you can’t determine the longer effects changes have or their relationship impact on other issues further down the track.
For a more detailed analysis on annual renewal products, you may wish to read the Hastings Insurance Case Study.
What is a Trends Analysis?
In its simplest form, ‘trend analysis’ is the measurement of change over time. Measuring trends within your data allows you to pinpoint changes as they occur, and provides a useful way for you to benchmark against your company’s past performance. At a high level, this could be a quantitative measure of the number of account renewals a company turns in a period of time, or the number of customers who cancel their policies.
Although information like this can provide a high-level benchmark, it’s not useful in the quest to learn why a change in the metric has occurred when operations/marketing efforts remain relatively the same. The solution? Analyse the dataset in greater detail using unstructured text data. This qualitative analysis provides a data-driven explanation to the cause behind the score and allows you to identify key drivers.
Recommendation:
- Analyse qualitative (unstructured) data alongside quantitative data (the numbers) to improve the quality of the analysis: the level of detail obtained from the results allows you to enact data-driven solutions, not just work from assumptions.
Text comments from VoC feedback drives insightful outcomes
How can you ensure that your analyses are detailed enough to provide impactful results? Leverage data you’re already collecting such as; VoC text comments from feedback channels. Touchpoint Group’s AI Text Analytics tool reads and categorises thousands of rows of feedback per minute, applying a human-like understanding of the language used within customer data, tagging it into common categories (and subcategories) allowing you to jump straight into a detailed analysis, better yet it’ll create a relationship map to determine which categories are commonly discussed together.
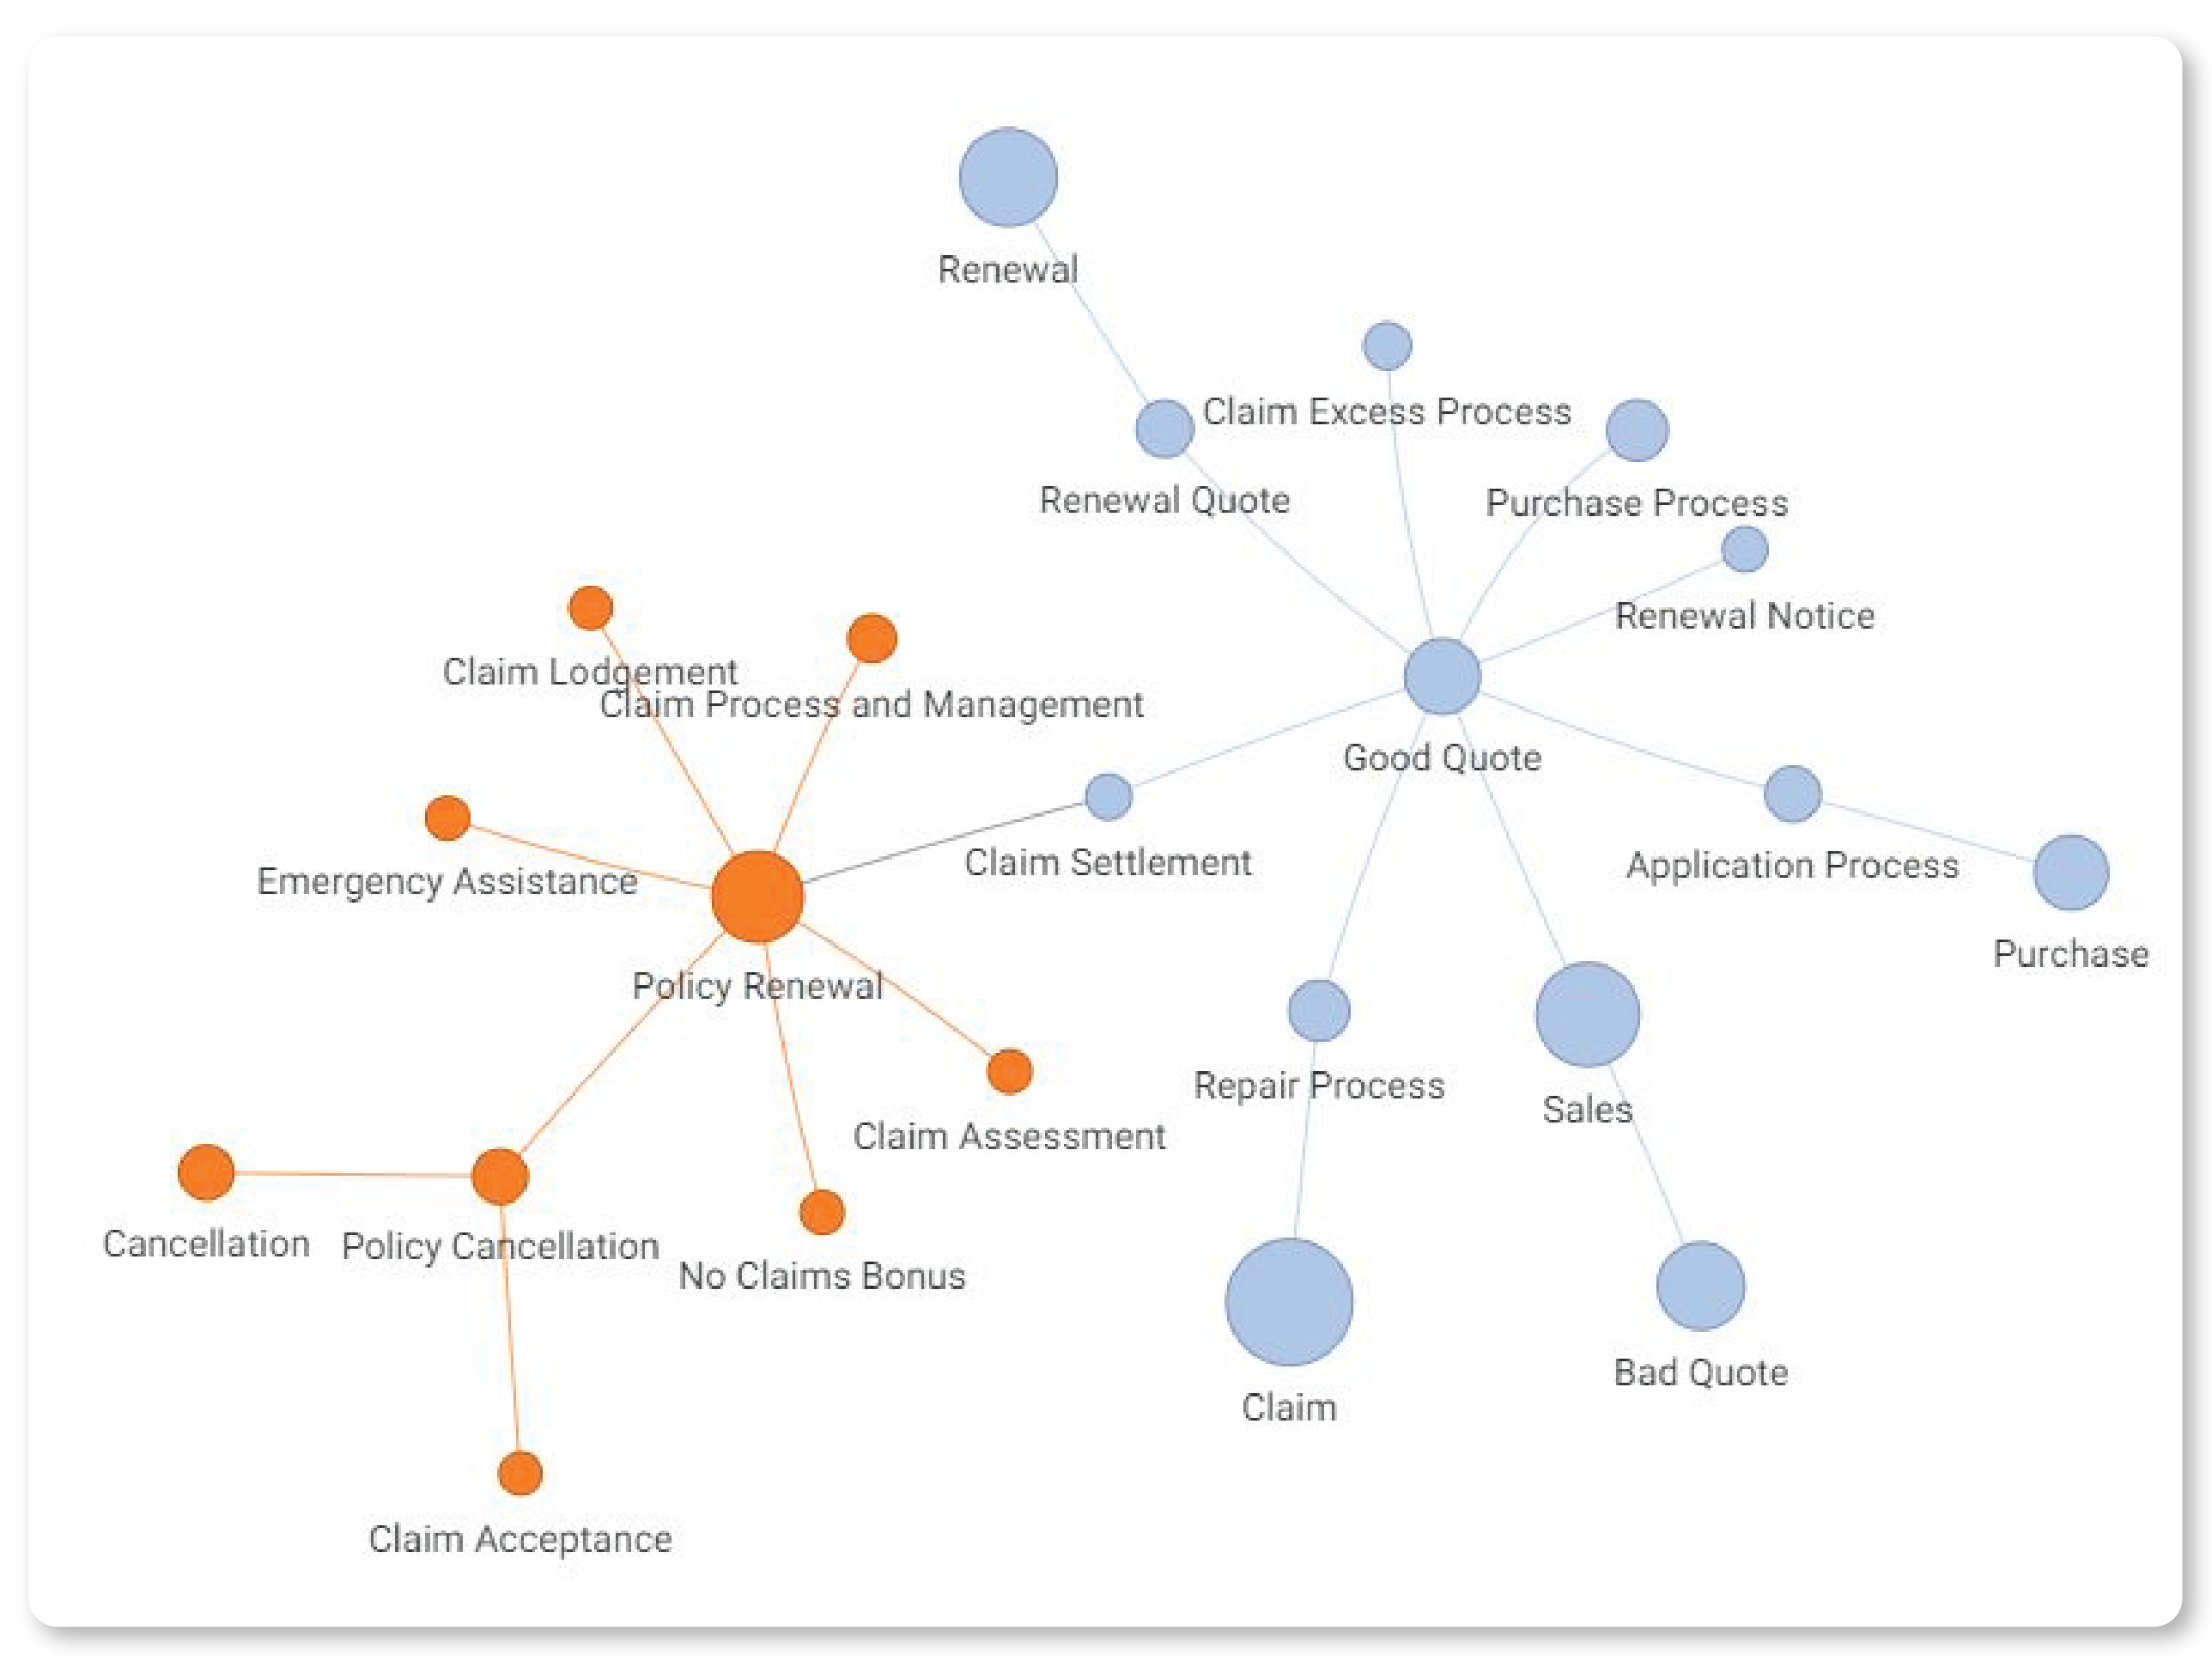
Understanding a customer's experience first hand is the key to driving improvements that have a direct impact on your businesses operations. When providing feedback, customers often offer detailed explanations of the issues they experience, in complaints, they’ll highlight multiple areas of concern through their journey. To understand how a customer truly uses your service and the process they go through to get to the issues they are experiencing you need to understand how these touch points interact. This is only possible using AI analytics.
Recommendations
- Use AI analytics to understand the true customer journey and touchpoints with your business. Use this to detect operational issues and detect the root cause through relationship mapping. This will ensure a quicker, more efficient outcome to your solutions than solving the top layer of the problem which will result in minor or no change in your trend metrics.
Identifying the root cause behind a drop in score reveals the critical detail needed to offer solutions
The following time series chart tracks the overall score for five Insurance companies against an overall average. We can see that Admiral Insurance starts the year as the lowest scoring company, but benefits from a sharp upward trend from June to August (analysing your quantitative data).
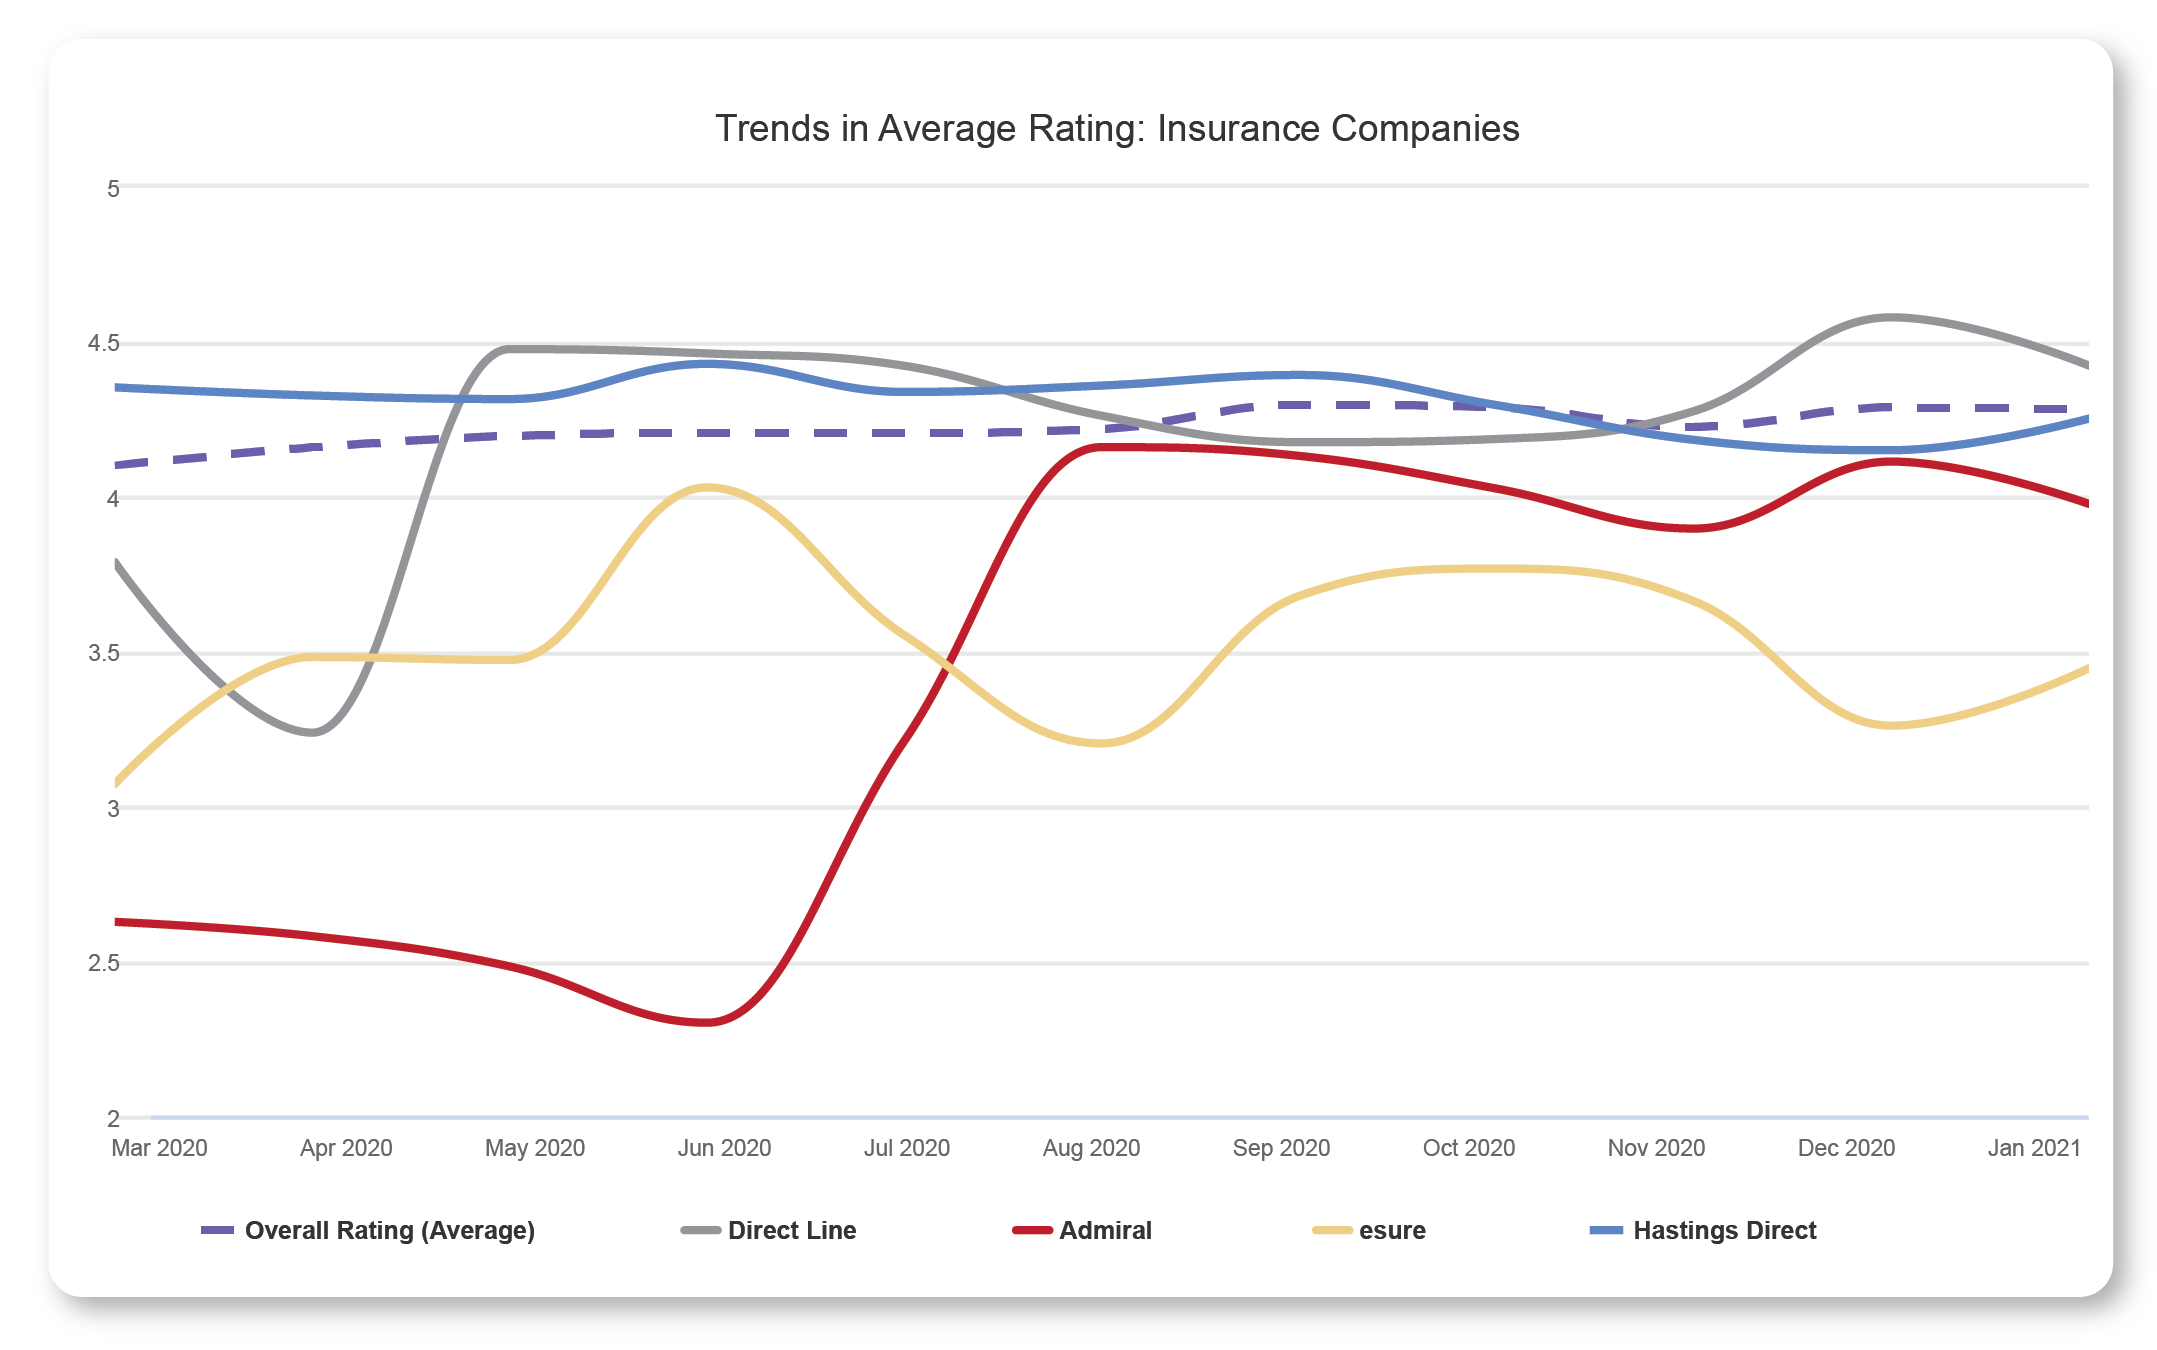
From this view, we can tell that the improvement moved Admiral’s average score from around 2.25 to 4, but we can’t identify the reason for the shift. However, using feedback data (your unstructured customer comments) it’s easy to drill down and identify the reasons for this dramatic improvement, giving you the opportunity to harness the results to drive further improvements.
We can explore the cause for this improvement by isolating Admiral’s data and automatically sorting the topics that customers discuss which have the highest impact on the score. Immediately, we uncover an explanation: All five of the high-impact topics relate to customer service, specifically staff interactions:
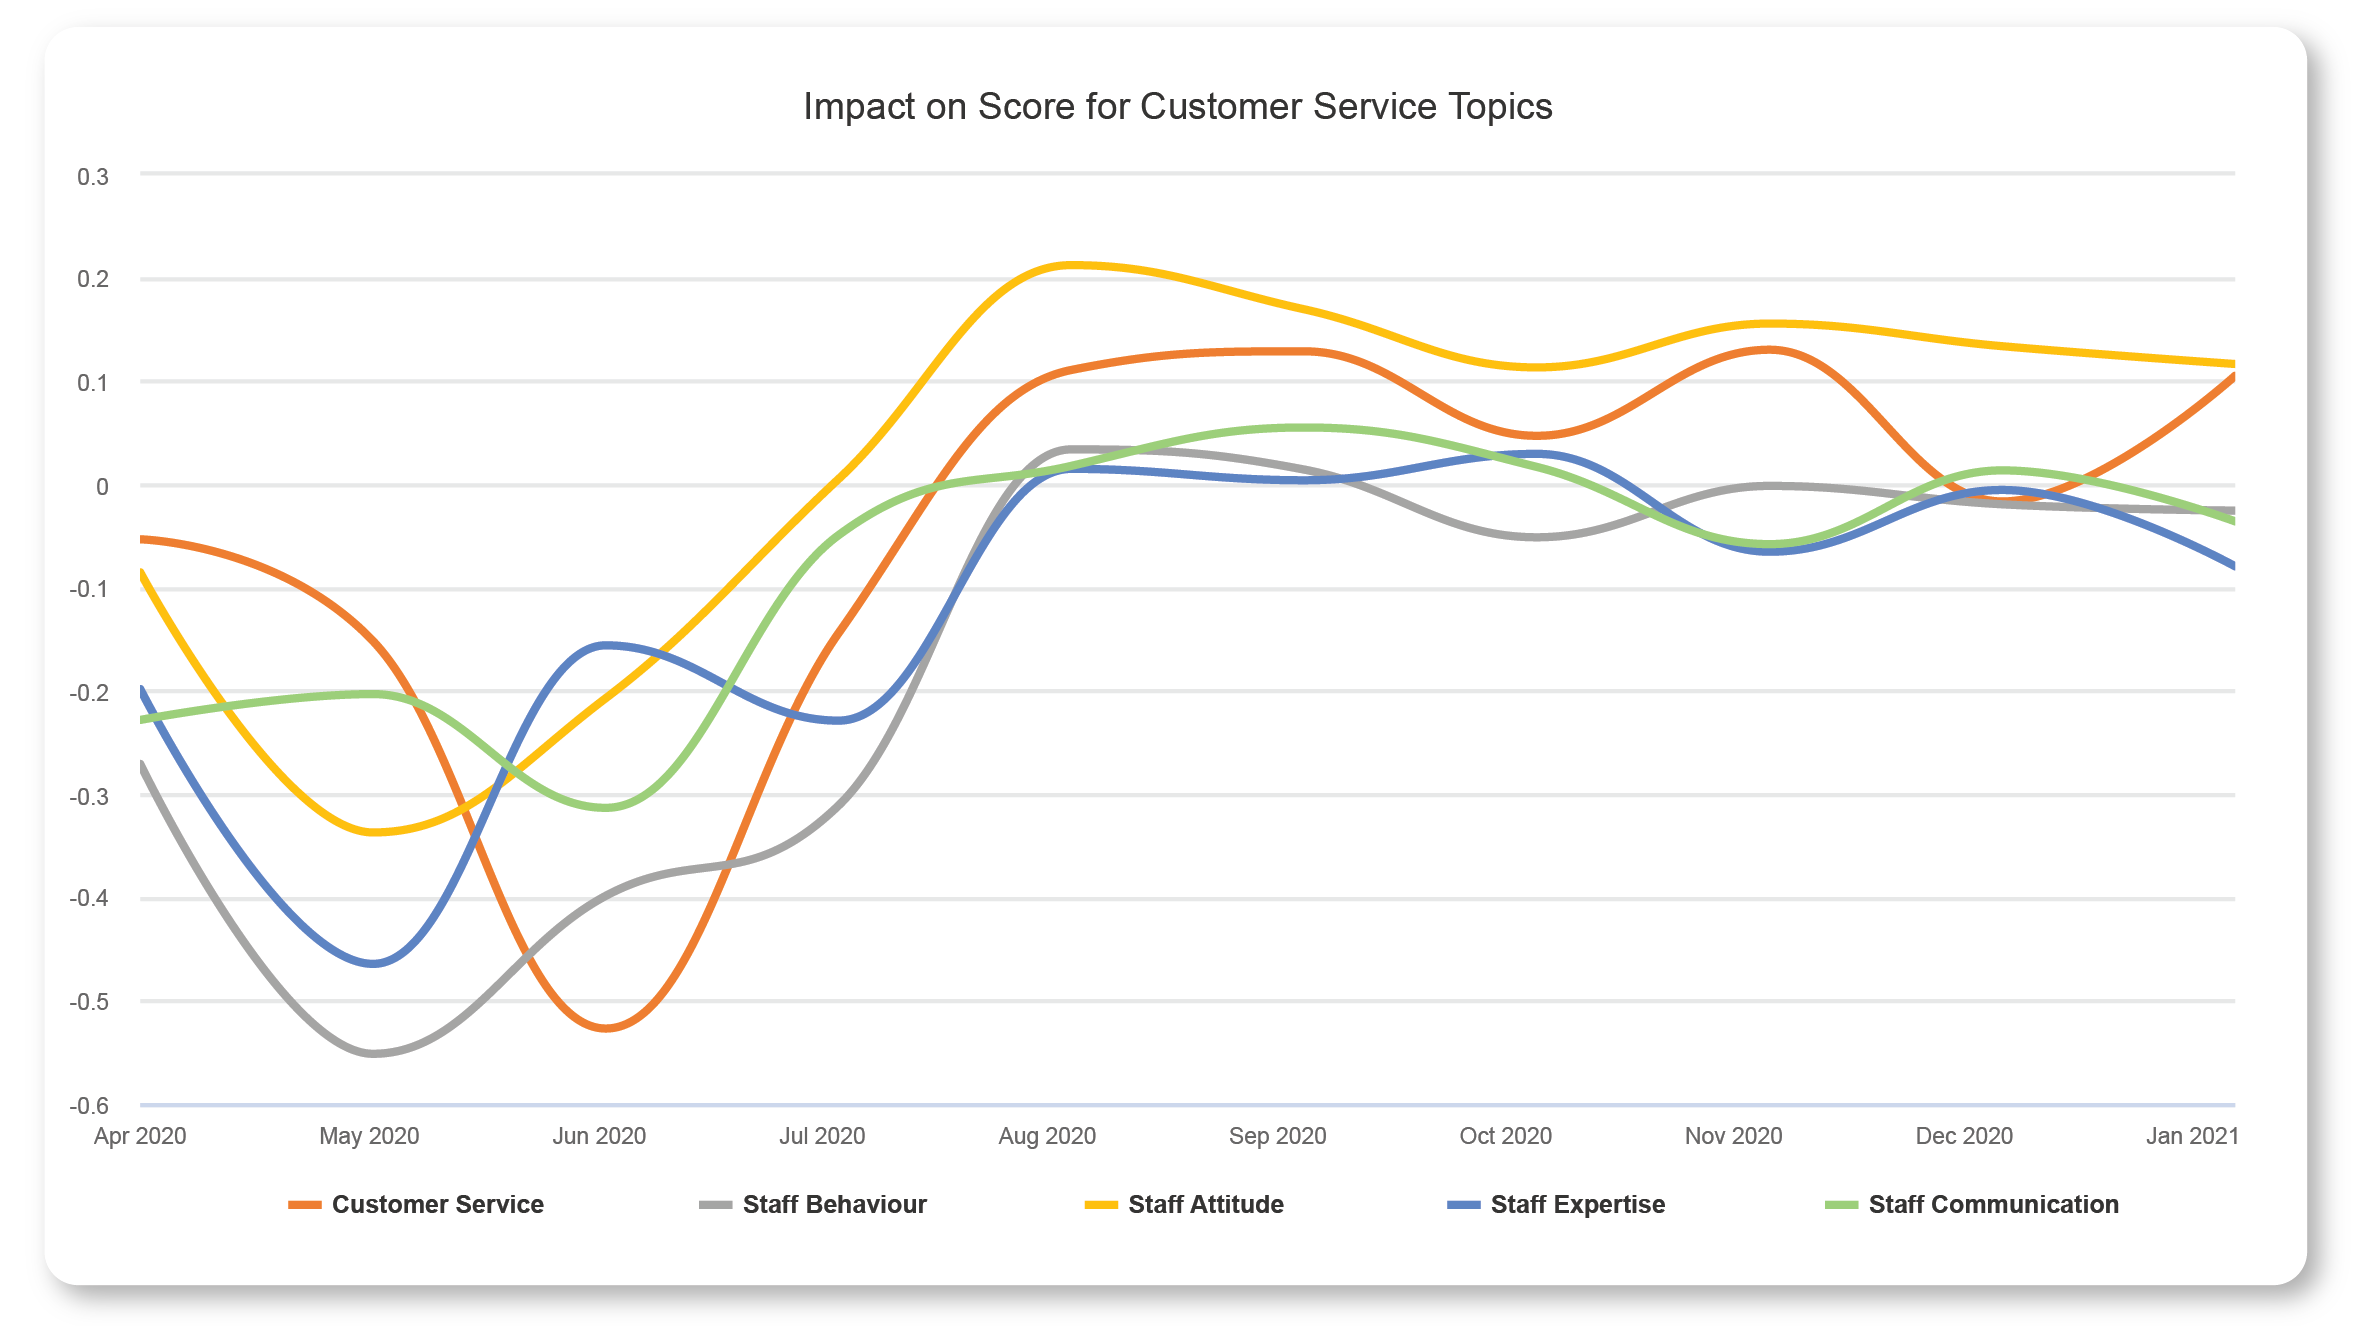
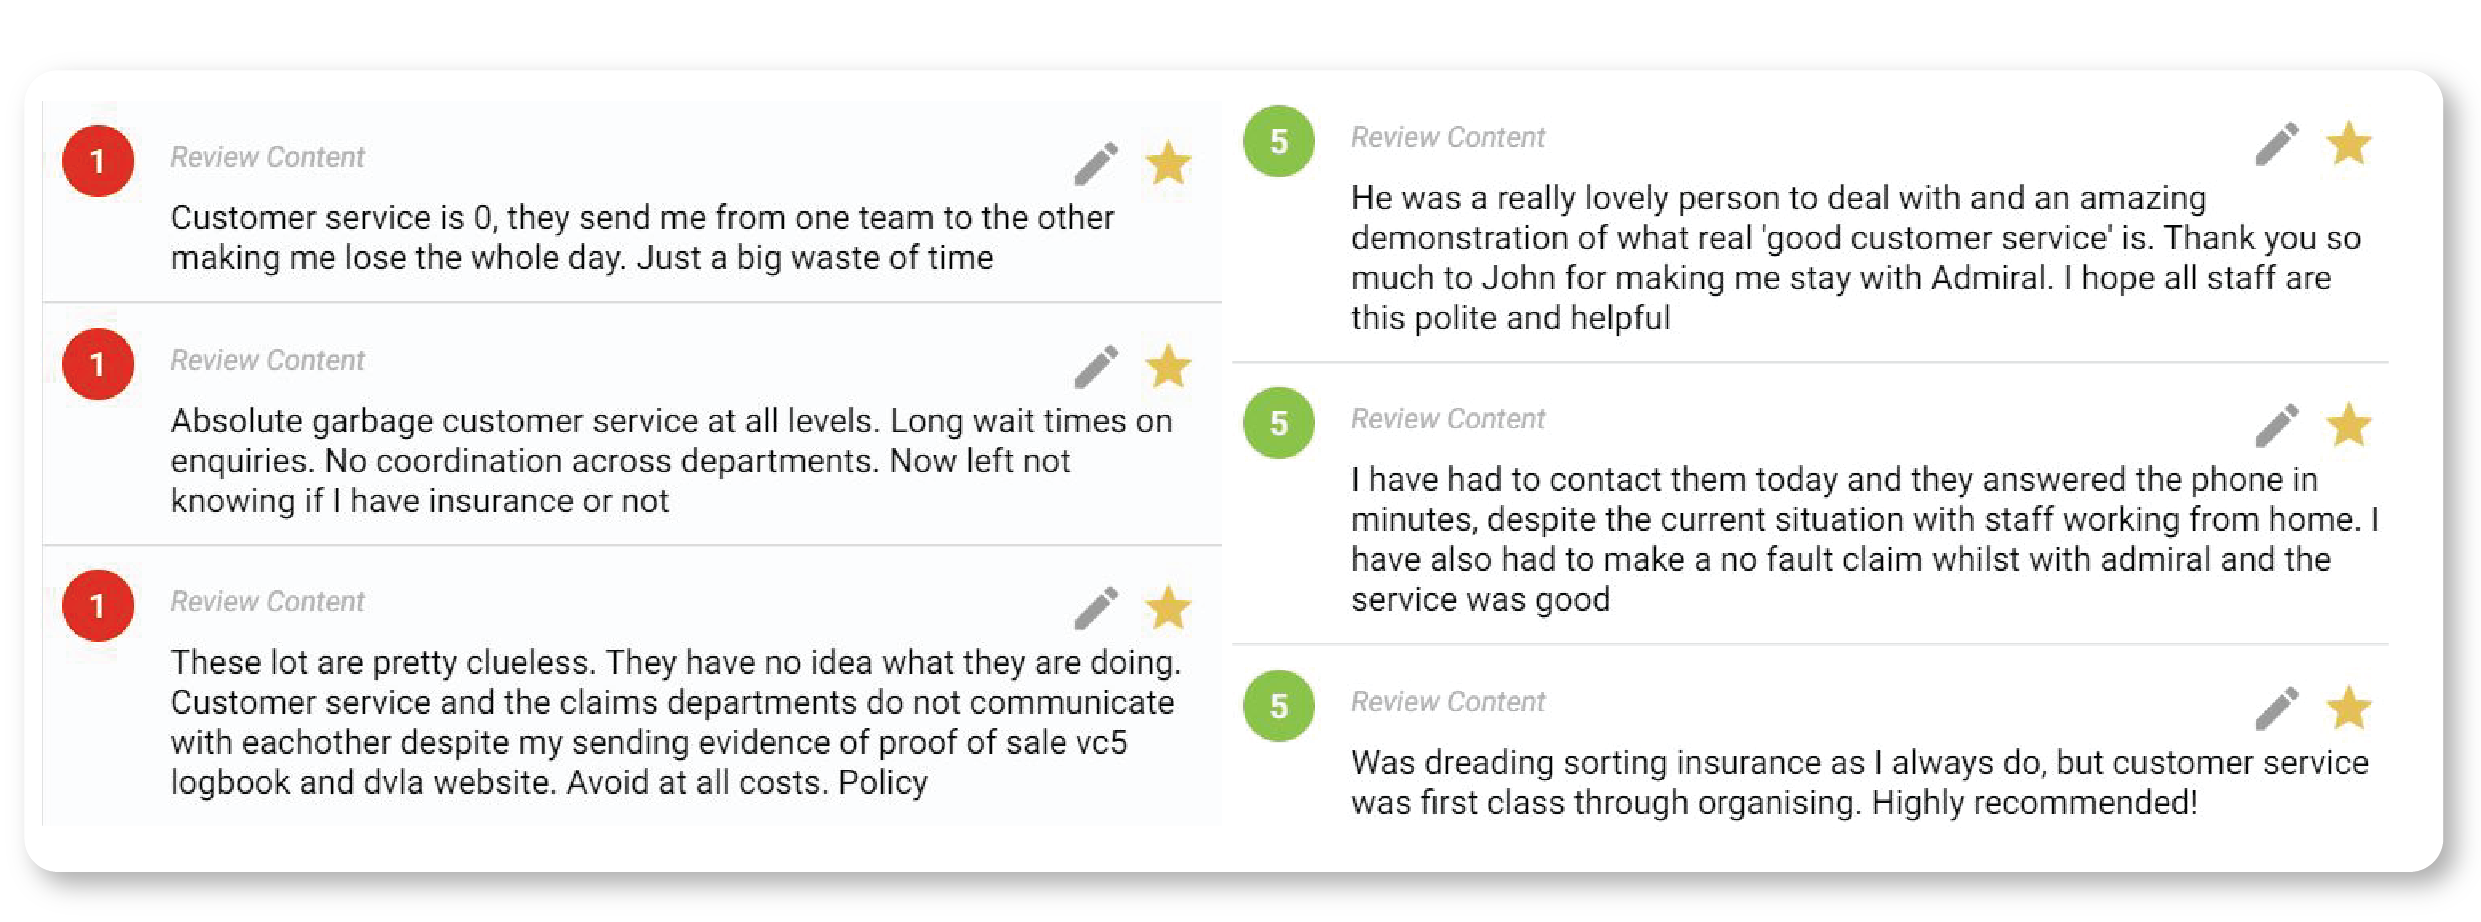
We can drill down into any one of these topics to understand what, exactly, about customer service improved between the months of June and August. Comparing customer comments from the low point (the months of May and June) with the high point (the months of August and September) gives us our answer: Admiral started this period dealing with a high frequency of negative customer experience, specifically dealing with slow call centre response times and inadequate issue resolution, and ended it with strong positive ratings for call-centre attitude, speed, and support.
While in this instance we have observed the resolution of this issue retroactively, it’s important to understand the quantifiable improvement that results when action is taken.
Admiral could leverage the granular detail available in Touchpoint Ipiphany even further to sweep up additional negative contributions to the score. They could also apply it to other departmental issues in their customer journey so that issues can be identified and resolved before they escalate to a several-month dip in ratings. The effect of these positive results could also be leveraged by the marketing team to inform prospective customers about Admiral’s dedication to improving customer experience, and evidence that they are acting on customer feedback. With no shortage of opportunities to leverage these results, simply resolving the issue alone seems like just the beginning!
In our next instalment in this series, we’ll explore the importance of a robust analytics framework in revealing the relationships that issues have across different stages of a customer’s relationship with your company, and understand how to address these relationships by delving deeper into the source of the problem. If you would like to learn more about leveraging AI customer analytics for your VoC feedback data, get in touch today to chat with our team of experts.